Recessions are slumps in aggregate income and spending that mark the end of a business cycle.1 While the U.S. economy continues to make new highs in aggregate income and spending as of Q3 2024, it’s worthwhile to imagine what might bring the business cycle to a swift end.
That’s because recessions don’t just happen. Business cycles don’t “die of old age.” Economies don’t “get tired” and “roll over.” What causes the pullback in spending that defines a downturn?
Economists have long argued about the causes of recessions. Proto-economists posited that sunspots were to blame for the business cycle's ups and downs. Bad harvests, as well as banking booms and busts, were often associated with the end of a cycle.
Our view is that recessions reveal the errors and excesses of the boom phase of the business cycle. Consider the 2007-2008 real estate-led downturn or the 2000s stock market-led slump. Investment and spending excesses in each period led to a flurry of activity (“business cycle expansion”). Inevitably, some investments were made in error. Liquidating bad investments and reallocating labor led to the tell-tale signs of a recession: plunging spending and investment and rising unemployment.
Being on the lookout for areas that have experienced a surge in investment and spending may help identify potential problems. Here are our top candidates for potential culprits sparking the next recession.
Consumers Less Than Durable
In many ways, U.S. households have engaged in far less excess in the 2020s than in the early 2000s (or any expansion before 2000). From 2020 to Q2 2024, household debt-to-GDP decreased from 82% to 70%, much lower than the lofty levels (120%) reached in 2005.
Still, a surge in spending in the 2020s went toward houses, autos, and appliances, and durables spending remains well above the pre-Covid trend. When we say “surge,” we aren’t exaggerating. Within six months of the start of the Covid-19 lockdowns, real (inflation-adjusted) durable goods spending increased by nearly 50% compared to its lows, while real services and nondurable goods rose only 15%.
Real services spending did not retrace to pre-Covid levels until July 2021, which is unsurprising since most services require in-person interactions. Today, real durable goods spending is still 68% above Covid-19 levels, while nondurable goods and services spending are 25% and 35% above, respectively (see Figure 1).
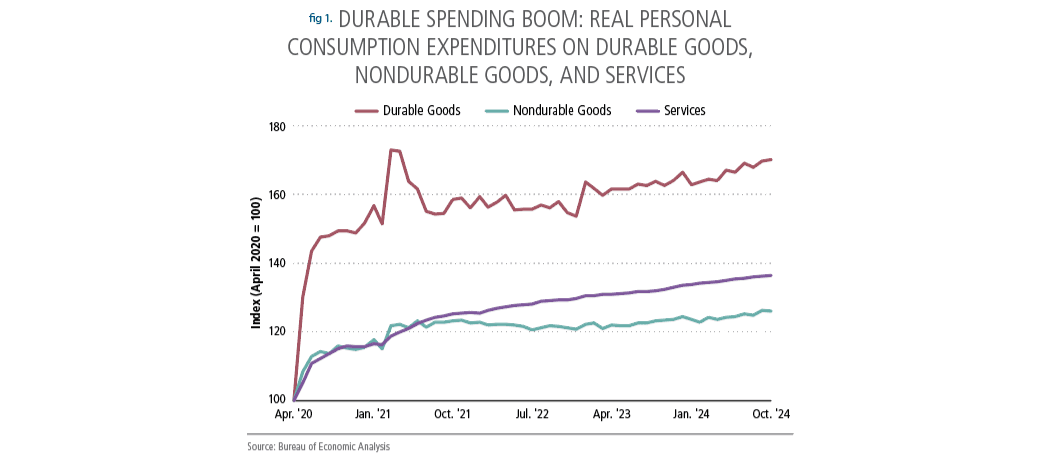
Is something fundamentally different with consumer durables, or are we due for payback? Overspending on goods in 2020-21 could create economic and financial issues with a lag, leading to a spending slump.
Wealth Effect Reversal
The wealth effect theory states that consumer spending has a positive relationship with wealth levels.
In the current cycle, two key assets drove the cumulative increase in household net worth: housing and stocks (see Figure 2).
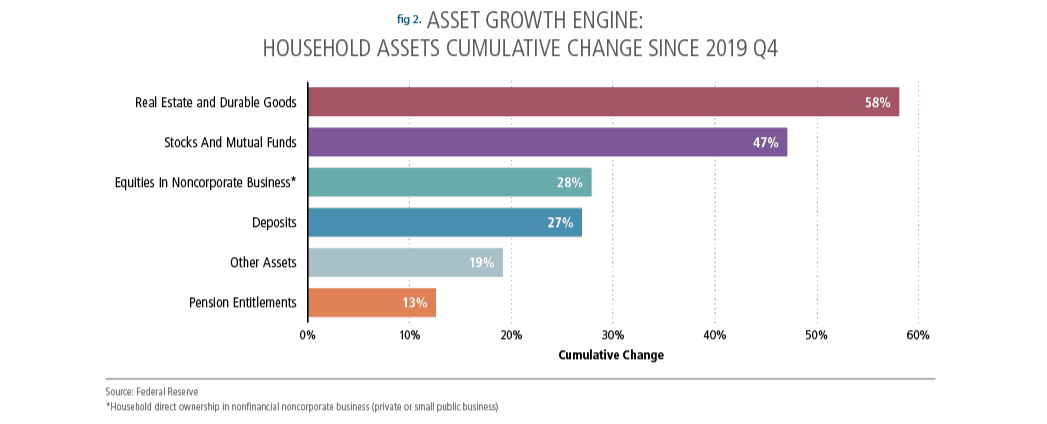
First, house prices surged during Covid-19 due to remote work, low interest rates, and supply constraints.
With a consistent lack of single-family housing supply, home prices remain elevated, but price growth has stagnated in most markets. With the Fed cutting rates in earnest, mortgage rates might get low enough to let first-time borrowers jump into the market. Increased transaction activity could lead to a surge in housing inventory and (finally) price discovery that could depress home prices (see Figure 3).
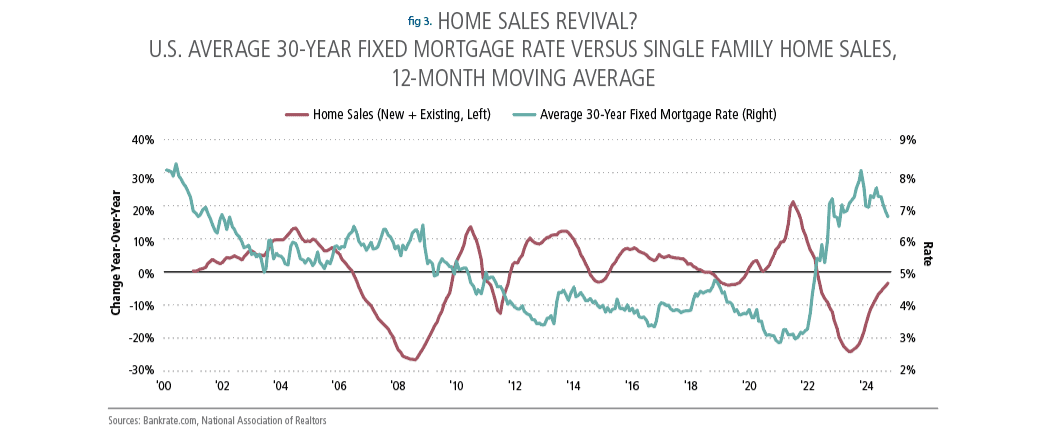
The last time prices fell year-over-year for more than two quarters was during the Global Financial Crisis—in the depths of the downturn and the recovery period. There could be knock-on effects since real estate ownership is a major component of the average household’s net worth (~30%).
Like housing, equity valuations remain stretched. The cyclically adjusted price-to-earnings (CAPE) ratio for equity markets has been higher than 35 for three months (see Figure 4). The stock market was more overvalued only twice: between February 1998 and February 2001 and, more recently, between February 2021 and February 2022.
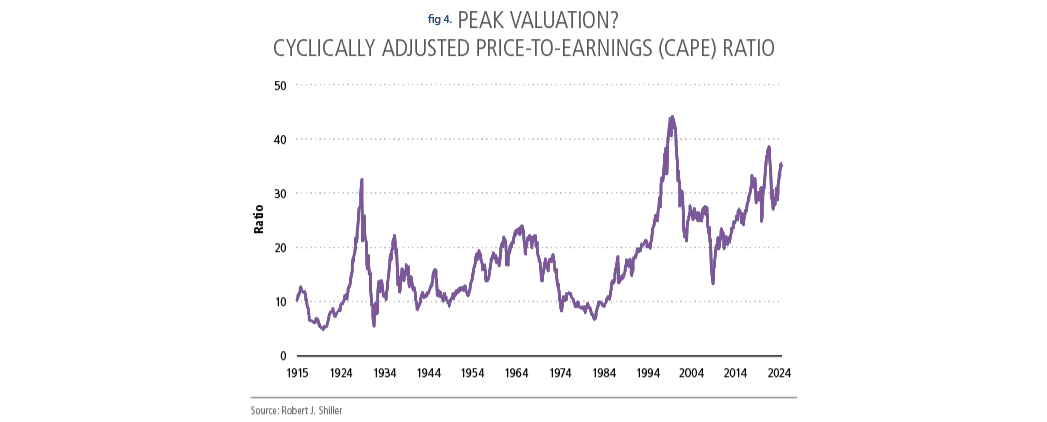
In addition, equity market concentration is the highest we’ve seen since the 1960s, with the top 10 firms’ market cap accounting for 27% of the total market cap of all companies listed on the New York Stock Exchange and NASDAQ in 2023.2 In the late 1990s, the top 10 firms reached only around 20%, just two years before the dot-com bubble burst.
More interestingly, seven of the top ten companies today invest in AI-related technologies, whereas five of the top ten in 2000 invested in internet-related technologies. Further, U.S. companies have invested $335 billion in AI in the last ten years, 60% of which was spent in the previous three years alone. As the CEO of Alphabet, Sundar Pichai, has said, "The risk of under-investing is dramatically greater than the risk of over-investing for us [in AI].”
If that quote doesn’t scream “overinvestment risk,” we don’t know what does. A significant housing or stock market correction could spill over into a pullback in consumer spending and capital expenditure, inducing the next downturn.
Private Credit Risk Lives In The Shadows
Another way to consider recession risk is to find areas of rapid credit growth in a relatively short period. Private credit is one obvious example.
Private credit is direct lending to businesses by non-banks. While private credit only amounts to about 15% of total credit extended to companies in the U.S., it has grown at an average annualized rate of 20% between 2018 and 2023!
By June 2023, private credit assets had steadily grown to $1.6 trillion in the U.S. and $2.1 trillion globally—around 75% of the size of the global high-yield market.3
Moreover, private credit sector loan capacity is evolving rapidly. From 2013 to 2020, private credit was geared toward middle-market companies, with an average loan size of about $65 million. However, in both 2022 and 2023, private credit firms engaged in more than 50 “jumbo-sized,” $1 billion-plus transactions.4
Transaction sizes and growth are one thing, but which sectors received the most private credit financing? In the last three years, information technology accounted for 41% of global deal volume, with healthcare accounting for 14.5%.5 Coincidentally (or not!), those two sectors also account for a large part of equity market outperformance and job growth.
Too Many Apartments, Not Enough Tenants
We saw a surge in apartment construction in the last few years as multifamily housing became one of the most in-demand types of commercial real estate property following the pandemic. The completion of new multifamily construction has averaged 509,000 units per month since 2023, double the monthly average of 253,000 units completed from 2010 to 2019.
Due to the flurry of construction, we now have a massive pipeline of multifamily projects still on the way to completion. In 2023 and 2024, the number of multifamily units under construction averaged nearly one million, almost twice the number of units in the multifamily construction pipeline before Covid-19.
Yet apartment vacancy rates rose a whole percentage point from their cycle-low in June 2022. With nearly another million units of apartments scheduled to be completed and leased in the next two years, oversupply could depress rents. A downturn could ensue if investors justified their investments by plugging assumptions into their spreadsheets that were rosier than reality has on offer.
Covid Era Overhiring
The post-pandemic labor market was characterized by skyrocketing labor demand and an extreme labor supply shortage. Job openings rose nearly 163% from their lows during the pandemic to the hiring peak in March 2022, while the labor force increased by only 5% during the same period.
Since then, job openings have fallen steadily and are now closer to their levels in 2019. A pickup in new entrants into the labor market, mainly through immigration, drove up supply, helping rebalance the overheated jobs market.
Will either job openings slowdown or an immigration plunge be the catalyst for
rising unemployment?
Indeed, news of tech industry layoffs made headlines starting in 2022. California, which hosts a large concentration of tech firms, saw its unemployment rate rise to 5.4% in October 2024, compared to its cycle low of 3.8%. Information sector job openings are now below the 2018–2019 average.
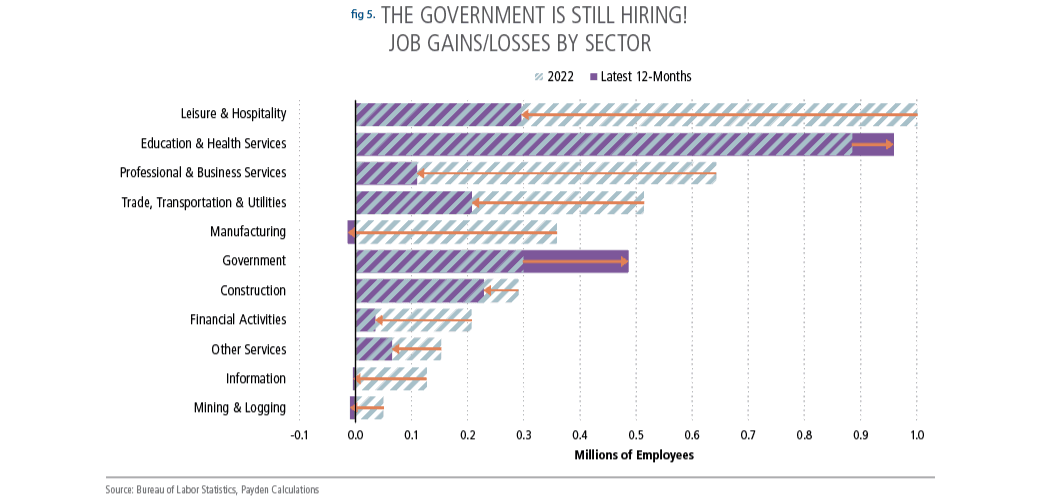
State and local government spending also contributed to hiring. Government employees, mainly for state and local governments, have accounted for 5% of the nonfarm payroll employment growth in the current expansion, compared to only 1.4% in the previous expansion cycle. With job growth slowing materially for all other sectors (as of October 2024) compared to 2022, government jobs might be another standing pillar we can’t afford to see fall (see Figure 5).
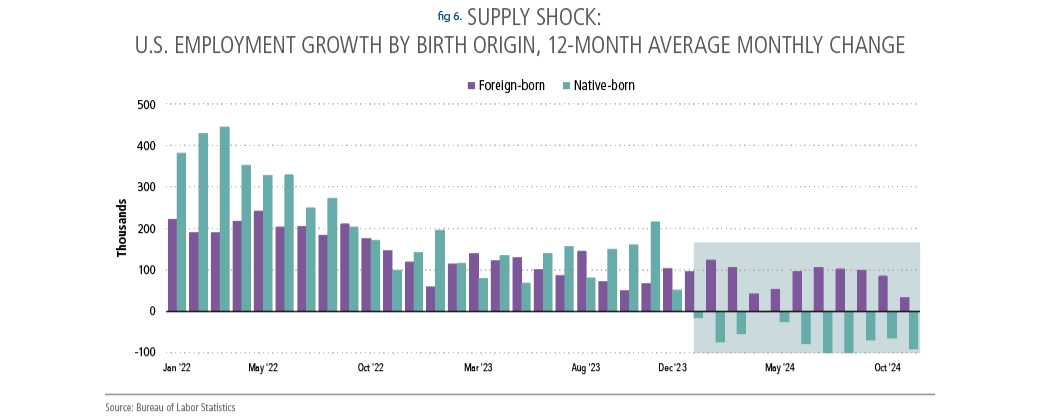
Finally, immigration—the largest driver of labor supply growth in the current cycle—could lose momentum. In the last two years, foreign-born workers in the labor force have surged by 3.2 million, compared to a 0.6 million increase in native-born workers (see Figure 6).
With hiring slowing and the immigration surge tailing off, we could see a rising unemployment rate and decreased spending, the general recipe for the start of a recession.
China Global Spillover
So far, our consideration of recession risks has been U.S.-centric. To be fair, with the U.S. accounting for 26% of the world's GDP, the rest of the world will get a cold if the U.S. sneezes.
However, China’s economy is important to the world, too, especially with China now directing investments into globally competitive manufacturing arenas to offset its housing sector slump. In a world where China dominates the supply or demand of major trade commodities, any domestic weakness in China might easily spill over to its major trade partners.
Excessive household savings (historically near 40% of household income) feeding into investments have been the driving model for China’s above 10% annual growth for the last two decades.6 However, China’s cumulative growth since the pandemic fell far short of its pre-Covid growth trend. With the housing sector no longer absorbing the excess savings from households, private investments are flowing into export-oriented manufacturing industries, such as electric vehicles, solar panels, and perhaps semiconductors.
The transition is well underway. In 2023, China became a global leader in electric vehicle production, accounting for 60% of total EV production worldwide.7 Further, China is the dominant producer of solar panels in the world, accounting for over 80% of all manufacturing stages of solar panels globally as of 2021. Such mind-boggling statistics set off our recession radar as areas that could reverse, tipping global growth into a downturn.
Wrong Until It’s Right
We’ve picked our top areas to watch for the next recession, although new risks are probably popping up in media headlines as we speak.
The bottom line is that recessions have causes, so it’s worth using your imagination to gauge where the next recession might originate. While we think the U.S. economy will avoid a downturn in the next six months, when times are good, you want to scour the world—and your portfolio—for possible risks.
Also, as the old joke goes, economists never see the recession coming. If there’s a semblance of truth in comedy, what did we miss?
Endnotes
The official arbiters of recessions demarcate the “business cycle peaks and troughs” using an array of indicators. In particular, the National Bureau of Economic Research (NBER) focuses on “real personal income less transfers, nonfarm payroll employment, employment as measured by the household survey, real personal consumption expenditures, wholesale-retail sales adjusted for price changes, and industrial production.”
Mauboussin, M. J., & Callahan, D. (2024, June 4). Stock Market Concentration - How Much Is Too Much?. Morgan Stanley Investment Management. https://www.morganstanley.com/im/publication/insights/articles/article_stockmarketconcentration.pdf
Cortes, F., Diaby, M., Ferreira, C., Khanolkar, N., Samuel Kraus, H., Mosk, B., Sugimoto, N., Yakovlev, D., & Novikova, N. (April 2024). “The Rise and Risks of Private Credit.” IMF Global Financial Stability Report. International Monetary Fund. Retrieved from: https://www.elibrary.imf.org/display/book/9798400257704/CH002.xml
Degerli, A., & Monin, P. (August 2024). "Private Credit Growth and Monetary Policy Transmission," FEDS Notes. Board of Governors of the Federal Reserve System. Retrieved from: https://doi.org/10.17016/2380-7172.3565.
Cortes, F., Diaby, M., Ferreira, C., Khanolkar, N., Samuel Kraus, H., Mosk, B., Sugimoto, N., Yakovlev, D., & Novikova, N. (April 2024). “The Rise and Risks of Private Credit.” IMF Global Financial Stability Report. International Monetary Fund. Retrieved from: https://www.elibrary.imf.org/display/book/9798400257704/CH002.xml
International Monetary Fund (IMF). (2024). Gross national savings, percent of GDP. Retrieved from World Economic Outlook database.
International Energy Agency (IEA). (April 2024). Global EV Outlook 2024. Paris. https://www.iea.org/reports/global-ev-outlook-2024, Licence: CC BY 4.0